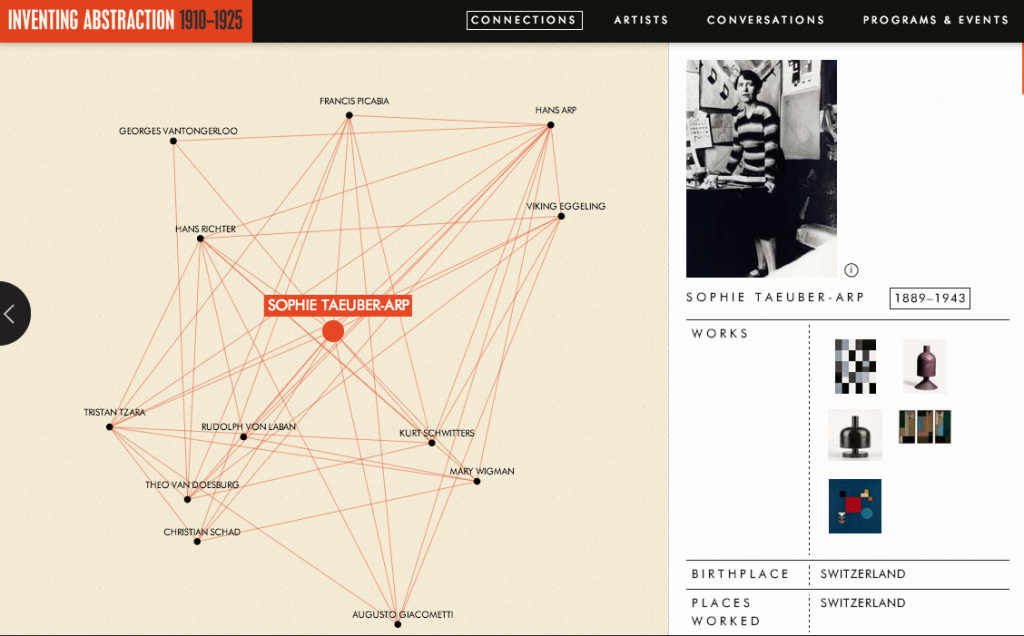
 MOMA has a terrific visualization as part of a show on Inventing Abstraction that opened back in December 2012. Visualization projects that map interconnections become complex quickly in a number of ways:
- Content for each subject: How much should you display? This seems like the right amount, although there’s something hilarious about seeing Picasso’s interests reduced to an all-caps summary: GUITARS, MODELS, CUBISM, SUMMERS IN CATALONIA
- Content that informs the connections: What’s the data source for these? Who relates to whom? How closely? How do you display relative strength of relationships, if at all?
- Overall user experience: How will users know what to do? Where to start? Is the story that is emerging the one you started out telling?
- Movement: What’s too sensitive? What’s not sensitive enough?
- Technology: How can this work everywhere you need it to? This is mostly a solved technical problem, but not trivial in a world of proliferating devices. Will this ever be projected? What’s the level of accessibility required?
- Flexibility: Depending on the life of your product, how do you handle new data about relationships? What’s the governance process for change post launch?
Information aesthetics also points to a great three-minute movie made about the mapping process which gets to the complexity under the hood here.
Reviews of the show overall can be found in The New Yorker and The New York Times, but only the latter of these mentions what struck me immediately in the visualization — the unusually large number of women represented as creators and not only subjects of an artistic movement.