Tag: youtube

  • Friday 5 — 3.24.2017

    Friday 5 — 3.24.2017

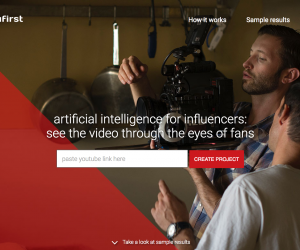
    1. YouTube has released an AI-powered emotion engine that helps video creators, aka influencers, understand which elements are most and least effective. YouFirst shows the video to a segment of the creator’s audience, uses facial recognition to identify the “power moments” that resonate, and can even tell you which groups of people enjoyed different parts of the content.
    2. Anyone remember when building a website meant hiring a webmaster and writing a million dollar check for servers? Now there’s Universe, a mobile-only tool that lets you set up a website in under a minute.
    3. Read this useful summary of how to get the most out of Google Maps. I’ve noticed that the “explore” button has been getting a lot better lately. Another new fun/creepy feature: share your location with others.
    4. In many enterprise organizations, there’s been a rapid proliferation of social media accounts. Prophet explains how to kill the social media accounts you no longer need.
    5. NiemanLab reports that people trust news based on who shared it, not who published it. This underscores the need for news organizations and brands to consider their audience as social ambassadors and invest in building strong communities.

    Weekend fun: How to use the phone privately in an open office setting and scare the life out of your co-workers. Also, a useful test for sniffing out voice-activated devices.

    Consumed: Upgraded from Palestra hot dogs to phenomenal fried chicken and biscuits at Bubby’s.

    Spring break: Skipping March 31 and back on track April 7. Until then, don’t talk to strangers.

    Every Friday, find five, highly subjective pointers to compelling technologies, emerging trends, and interesting ideas that affect how we live and work digitally. Sign up for a weekly email.

  • Friday 5 — 5.1.2015

    Friday 5 — 5.1.2015

    Video Viewer Stats

    1. Facebook is up to 4 billion daily video viewers, and some think it may unseat YouTube as the go-to video destination. Not much of a present for YouTube’s 10th birthday.
    2. Instead of bucketing content referrals by each social network, BuzzFeed launched a new technology to track content shares across social networks. Dubbed Process for Optimizing and Understanding Network Diffusion (POUND), the system offers a realistic, more nuanced view of how stories spread. Buzzfeed’s own post buried the lead — the data show that sponsored content is shared just like editorial content.
    3. Click wisely: Nearly 2% of Gmail messages are designed to trick users into giving up their passwords, and well-crafted phishing schemes are effective 45% of the time. Given those scary statistics, this week Google launched Password Alert to let you know when a password reset may be in order.
    4. Why is Snapchat getting into the news business? With hundreds of millions of users, a valuation of $15 billion, Snapchat is becoming one of the fastest-growing media platforms in the world. With a critical new editorial hire, a built-in audience, and the pipes laid, deciding what to flow through seems to be a natural next step. The question is whether the Discover tab can serve as its own destination, or will remain a time-waster between user-generated snaps.
    5. In my experience, there are few things more time-consuming or expensive than a free trial of new software. The Chief Marketing Technologist blog includes this advice among other useful suggestions in 8 useful tips for marketing tech companies on pitching CMOs.

    Weekend fun: So much for “Canada nice” — the poop emoji is a big hit in Canada. Here’s how emoji usage by country breaks down. A little gross, sure, but a lot less creepy than the selfie arm.

    Every Friday, find five, highly subjective pointers to compelling technologies, emerging trends, and interesting ideas that affect how we live and work digitally. Try out the Friday 5 archive, or sign up for a weekly email.

  • Friday 5 — 07.26.2013

    Every Friday, find five quick links about compelling technologies, emerging trends, and interesting ideas. Source: the internet.

    1. Facebook’s Q2 numbers are in and the company appears to have mastered mobile ads — which now make up 41% of ad revenue.
    2. Google delivered Chromecast, a device that lets you watch the web on your TV for $35, and competes with the likes of Apple TV and Roku. Its approach is fundamentally different, though, using your smartphone as the interface for the TV experience.
    3. YouTube releases customizable subscribe buttons to allow users to follow channels from anywhere. It’s another way to promote the high-value content channels, channels you might develop a fondness for and watch on your TV screen via, say, Chromecast.
    4. Flipboard affirmed its position as both distributor and competitor to its content providers by launching a web-based version of the service. Publishers have used Flipboard to reach audiences on iPad, but may have questions about a web-based version that runs ads like their own sites.
    5. Visiting your parents this summer? Just how many times do you think you’ll see them before they die? This app offers up a best guess based on WHO health statistics — and provides great material for guilt-purveying mothers everywhere.
  • 6 ways to view the new YouTube trends map

    YouTube trends mapVideo on the internet has come a long way from the jerky, plugin-encumbered frustration of the late 90s to its speed and near-ubiquity today. YouTube now reports 1 billion unique monthly visitors watching more than 6 billion hours of video each month. The proliferation of smart phones and accompanying rise in social sharing mean that mobile video viewing is at an all-time high.

    Data visualization pro Martin Wattenberg has collaborated with the YouTube trends team to create a map of trending videos in the U.S. Six ways to explore the data:

    1. Click on any of the video thumbnails on the map to play. I’m generally not a fan of the lightbox treatments because they lose the metadata that provides context — but it works well here. Interestingly, the lightbox views seem to have no pre-roll. 
    2. Mouse over the video list by cities/regions at right. The other videos on a map will gray out and let you see at a glance what’s playing where nationally.
    3. Next, toggle between Shares and Views in the filter bar at top. I love this as a metric to understand what people enjoy watching versus what they suggest others watch.
    4. Click Male or Female in the filter bar to see what’s trending by gender. On Tuesday, the females seemed to be watching Blake Shelton while the males tuned into Charles Ramsey.
    5. Click the age ranges to see what’s trending by the usual bands. The high overlap between the 13 year olds and the 65+ crowd confirms my suspicion that the age reporting in YouTube is highly suspect. Twelve year olds tend to sign up as senior citizens to avoid age restrictions, and Google prevents them the changing the age on the account when they go back to fix it in their late teens.
    6. Finally, scroll down below the map to see the top videos trends bars. The colors cleverly derive from the video thumbnail, and offer a great visual that changes as you select filters up top. It’s a great way to see, for example, that tonight there is uniformity in what people are watching but far more variety in what they are sharing.

    The trends map is an immensely readable view of the enormous U.S. video data set. For large publishers of video to YouTube, this would be a terrific at-a-glance addition to a video performance dashboard.