Today 85% of U.S. adults are online, 64% are on Facebook, and a full 56% of us have a smartphone glued to one hand 1. Digital natives and immigrants alike are now accustomed to using technology in the flow of daily life. Previously discrete activities like checking email, posting photos to social networks, and shopping online, are now worked into pauses in the Starbucks line or on a conference call. But how do increasing digital fluency and integration manifest themselves in people’s professional lives?
It’s not always obvious how consumer-led digital fluency is resulting in enterprise business benefit. Sure, the rise of consumerization of IT has led to initiatives like Bring Your Own Device that bring workplace technology services more in line with personal technology expectations. But there’s still a gap between what people do in their personal use of digital, and their readiness to apply this knowledge to business challenges.
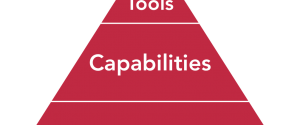
Below is one framework we’ve had some success with lately when assessing digital readiness in large organizations.
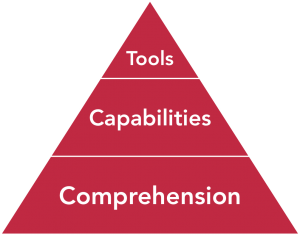
The process starts from the bottom, by assessing general comprehension of digital technology and how it might be applicable to traditional business processes.
- Are employees aware of ways technology is affecting their industry?
- Is technology used only to replicate offline processes faithfully online, or are both processes and practices consistently revisited?
- Are employees able to relate and apply general digital practices to specific business benefit?
- Is the language expanding? Are non-IT employees developing a basic vocabulary for digital?
Next, employees must develop the capabilities, through a blend of directed training and hands-on learning, to use new digital and social tools.
- Are there both formal training and peer-to-peer learning opportunities for employees?
- Are employees aware of and able to use basic collaboration technology, from project websites to link sharing?
- Are employees able to monitor and listen through digital and social communications to inform and advance their work within and beyond the organization?
- Are employees aware of ways they can create and publish content, whether through websites or social media?
Finally, does your organization provide employees with a clear selection of tools that enable new behaviors or increase efficiency.
- Do employees know how to find what they need to solve a problem, and who will support it?
- Are employees involved as advisors in the technology selection and rollout processes?
- Are there user testing protocols in place before tools are rolled out to employees?
- Are tools regularly benchmarked against consumer-led systems?
A typical mistake in technology-led rather than business-led digital initiatives is to start at the top of the pyramid with the tools, and then try to reverse-engineer business processes around them. Savvy organizations will start from the business need and raising comprehension of digital as it applies to the business. These organizations will also cope with some heterogeneity of tools in order to drive adoption, rather push for a monolithic approach that creates endless skunkworks workarounds.
There are some terrific frameworks out there to assess your organization’s readiness for digital transformation or social business maturity. Use this digital readiness checklist as a first step toward understanding your employees’ ability to engage in digital to advance the organization.
1 Pew Internet


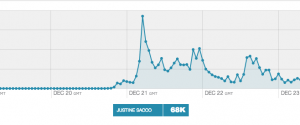
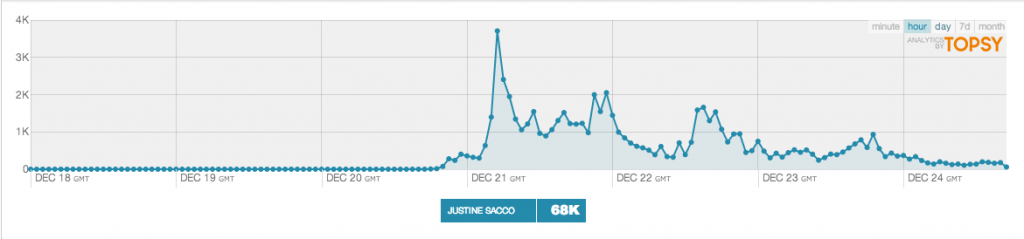 Too busy preparing for the holidays to have heard of l’Affaire Sacco? Buzzfeed has a