Tag: search

  • Friday 5 — 5.16.2014

    Friday 5 — 5.16.2014

    1. swarm
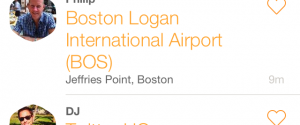
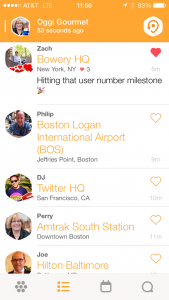
Foursquare begets Swarm, a mobile app that enables users to keep up and meet up with their connected friends. The check-in experience is largely the same, but new passive tracking allows for Neighborhood Sharing — which you can enable or disable with a swipe. Techcrunch describes the larger trend represented by Swarm and other invisible apps, as they move from a battle for the real estate on your home screen to just-in-time surfacing of contextual offers. Fun detail: your friends are defined as “right here” (500 feet), “a short walk away” (1.0 miles), in the area (20 miles), or “far, far away.”
    2. Do you have people you like to follow on Twitter, but whose streams become insufferable during Bruins playoffs, Game of Thrones finales, or SXSW? Or people you feel professionally obliged to follow? Now you can mute them, because Twitter really, really wants to retain its user base. Here’s how.
    3. Digital thinkers opine on the internet of things. Most agree on the inevitability of a “global, immersive, invisible, ambient networked computing environment …in a world-spanning information fabric known as the Internet of Things.” Opinions vary more on the benefit of ubiquitous data collection versus the associated risk of surveillance and tracking.
    4. In case you missed it, Jonathan Zittrain wrote a compelling editorial on this week’s ruling that Europeans have a limited “right to be forgotten” by search engines like Google. Bottom line: it’s a bad solution to a real problem.
    5. Pinterest begins its “tasteful” and “transparent” rollout of Promoted Pins, aka ads. With over 750 million boards and 30 billion pins, even a slow rollout represents a huge revenue opportunity for Pinterest (as investors behind its brand-new $200M round would agree).

    Weekend fun: Watch P.J. O’Rourke offer his hilarious, skeptical view on the “dark, Satanic mills” that exemplify our current state of technology.


    Every Friday, find five, highly subjective links about compelling technologies, emerging trends, and interesting ideas that affect how we live and work digitally.

  • Visualizing Crimea interest online

    Visualizing Crimea interest online

    Lots of thoughtful coverage of today’s significant events in Crimea at major outlets like The Guardian, CNN, and Politico, as well as through crowdsourced efforts to amplify local opinion, like Global Voices. Two quick snapshots of escalating web interest below.

    Google searches for Crimea over the past year:

    crimea searches

    Twitter mentions of Crimea and Sochi over the past month:

    crimea sochi twitter

  • Friday 5 — 1.24.2014

    Friday 5 — 1.24.2014

    1. Google search preview
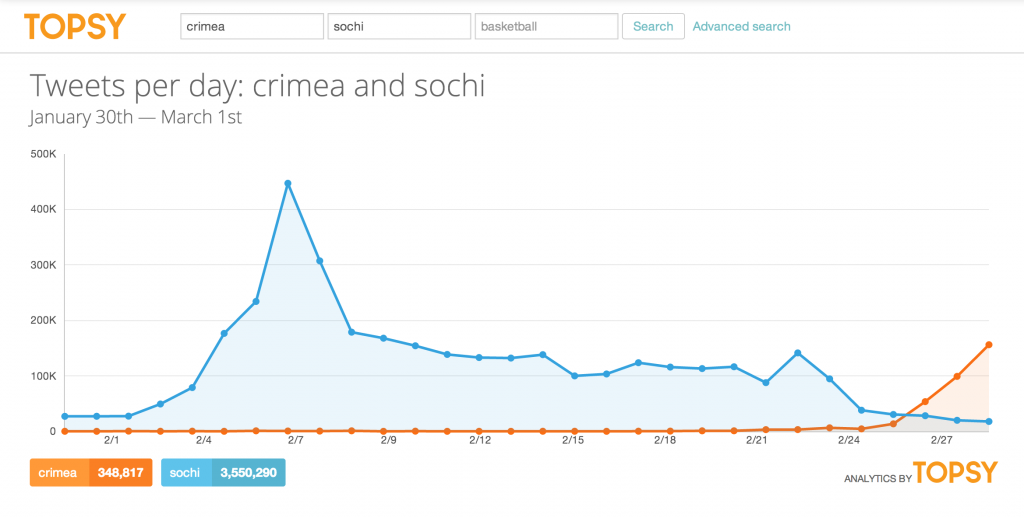
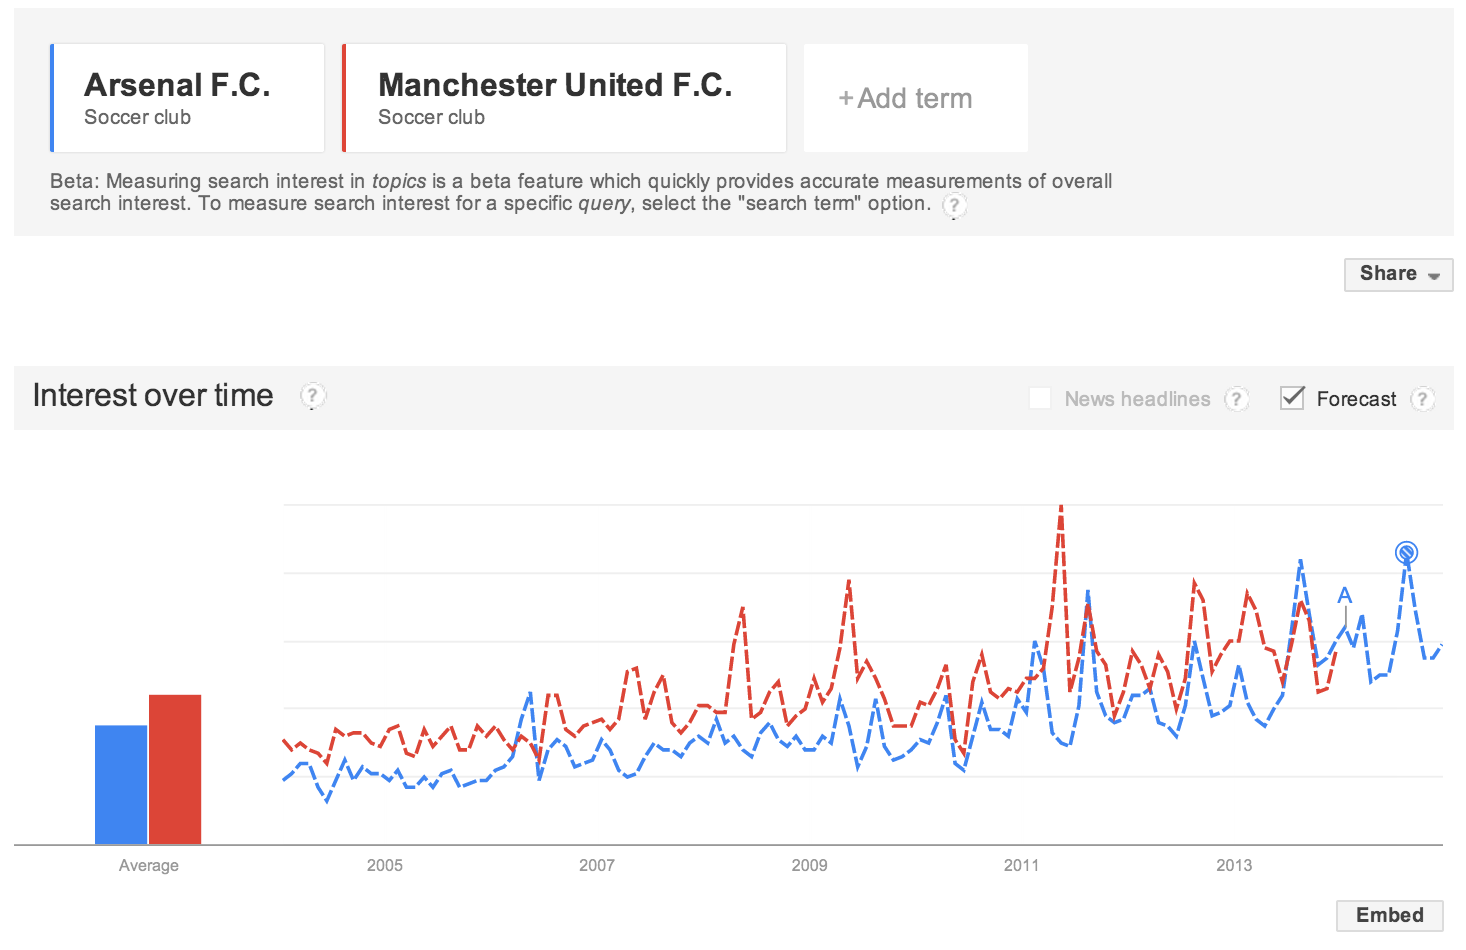
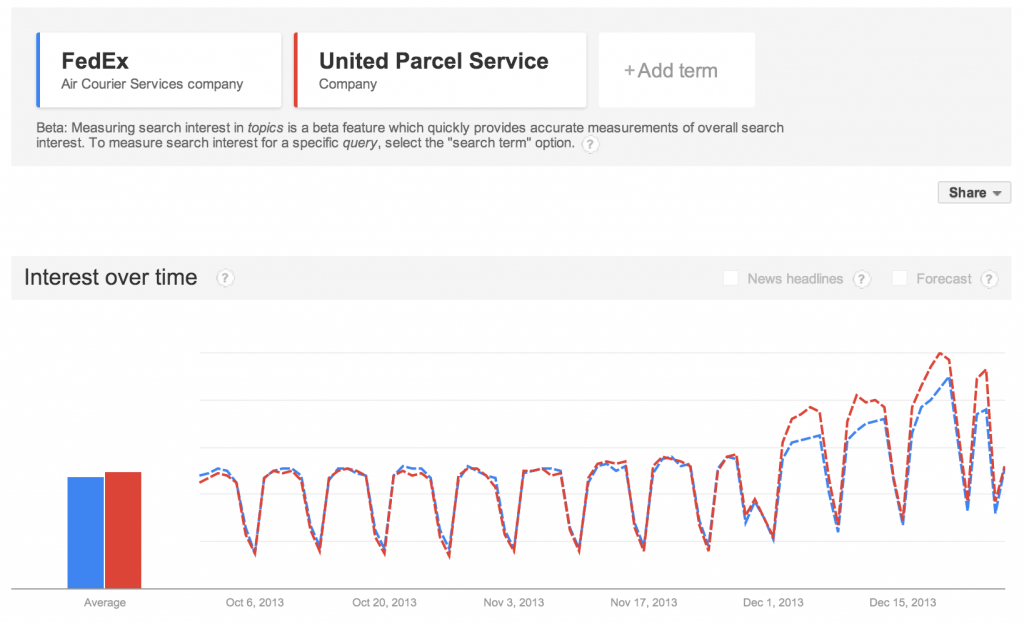
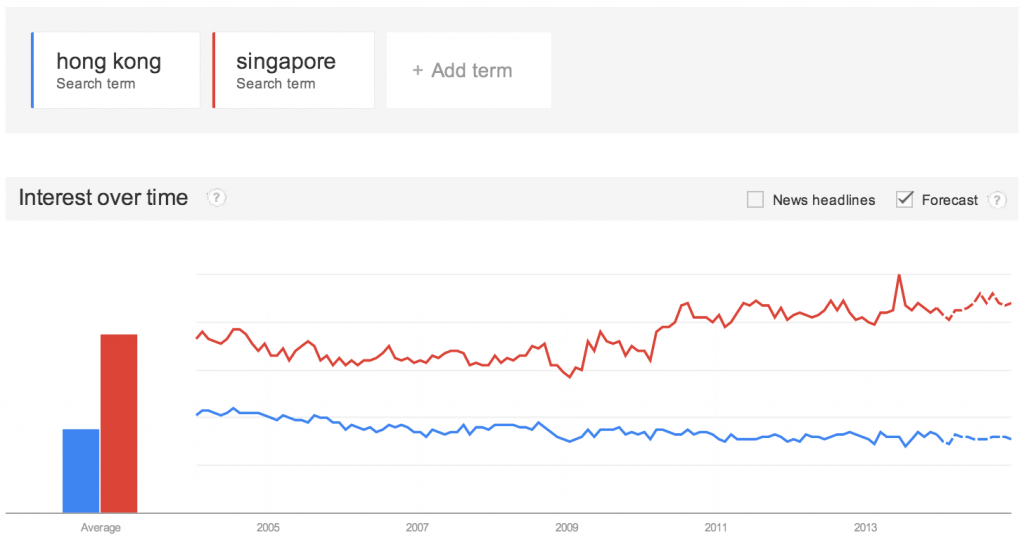
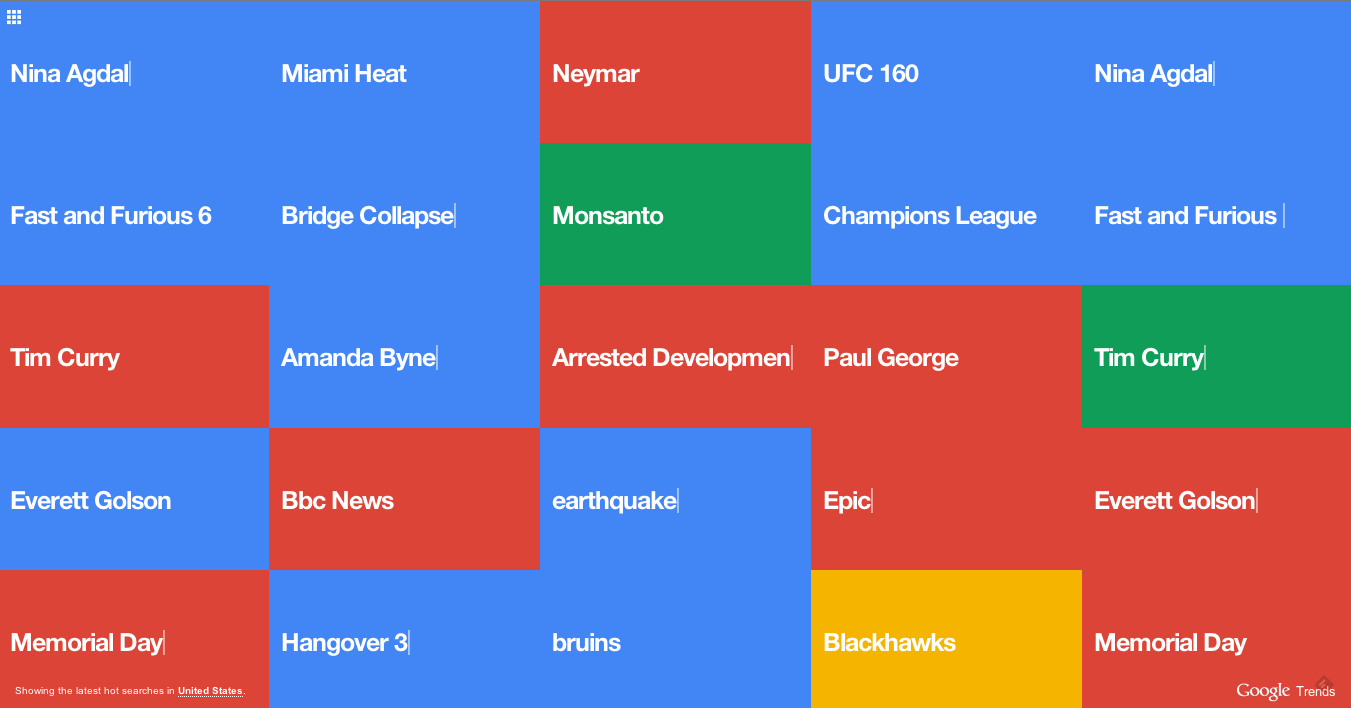
Google knowledge graph, which seeks to represent “real world things and their connections,” surfaces the relevant content you see on Google search results pages, like movie times. This week Google added to their results a short description of websites that are “widely recognized as notable online, when there is enough information to show.” There’s a lot of content creep from destination pages into search results, presumably to keep people on site for ad impressions on the Google domain.
    2. There’s a lot of credit for brands moving fast in social media — here’s a terrific insight on the value of social media restraint for brands. Now that news travels with us everywhere on our mobile devices, there’s a feeding frenzy quality to breaking news. Brands dive in to add context to the news — whether it’s an earthquake or a Bieber peccadillo. This article points out the value in recognizing that just because you can find an angle for your brand, it doesn’t mean you should.
    3. On February 4, a whole bunch of new generic top level domains (.gTLDs) will go live on the internet. Some feel this is just a clever way to part marketers from their money, with a hefty 185K price tag for each top level domain. Let the land grab begin.
    4. Every exec who’s ordered an agency team to deliver a viral video should check out this New Yorker piece of research that finds six elements of avidly shared content. They include emotion and an element of social currency that translates into the insider handshake. Miraculously, quality storytelling makes the list: apparently some cat videos are more equal than others.
    5. What do the Facebook news feed changes mean for brands? The updated algorithms will downplay text posts from brands in favor of more organic visual shares. This shift marks another way the visual web is raising the bar for content creators.

    Weekend fun: At the risk of becoming a character in this New Yorker cartoon, I still have to recommend you waste three minutes over the weekend watching this 8-bit version of The Big Lebowski.

    Every Friday, find five, highly subjective links about compelling technologies, emerging trends, and interesting ideas that affect how we live and work digitally.

  • When does Sherlock start again?

    When does Sherlock start again?

    Want a clunky way to figure out when the next season of Sherlock starts? Check out Google search trends for Benedict Cumberbatch.
    Benedict Cumberbatch search trend

  • Search interest: Arsenal vs. Manchester Utd

    Search interest: Arsenal vs. Manchester Utd

    Arsenal Manchester United search interest

    Highly unscientific, correlation is not causation, etc., but fun to see search interest in Arsenal FC rising and predicted to rise more as they finished 2013 at the top of the Premier League.

  • Where’s my stuff?

    Where’s my stuff?

    The trend of staying home and spending made for a strong online shopping season. Amazon recorded roughly 426 orders per second on Cyber Monday, and overall online sales were up 21% over 2012. Good news for some retailers, but the high volume combined with bad weather and a shorter than usual holiday shopping season to create a perfect storm for package shipping companies like Fedex and UPS.

    shipping searches

    Which firm is bearing the brunt of the blame? Google Search Trends topics view, which aggregates various search terms to gauge overall interest, suggests UPS may be fielding the most angry phone calls. You can see above where UPS and Fedex have had roughly the same search volume over the past 90 days. But UPS search volume rises sharply the first week of December with the largest differential right around Christmas. Welcome to the “Where’s my stuff?” debacle.

  • Friday 5 — 12.6.2013

    Friday 5 — 12.6.2013

    google trends

    1. Google Trends is a handy, visual tool for comparing topics by their relative search volume — see graph of search trends for Hong Kong and Singapore above. This latest release uses its vast historical data to offer dotted-line predictions of future search interest. Another useful feature: the algorithms now aggregate different searches likely to be related.
    2. Foursquare has released a new version of its check-in service, with a sleek new design and location-aware push recommendations. Just arrive at the Beat Hotel in Cambridge? Now Foursquare may suggest the tuna spring rolls based on your friends’ behavior. Since its 2009 launch, Foursquare has amassed a significant location data layer, and this release may be one way — apart from its rich API — to take advantage of it.
    3. Monday Note pulls together a number of recent charts to recommend mobile trends to keep in mind if you produce digital news. Thoughtful validation of the power investment in content strategy, with “newsletters designed for mobile that are carefully — and wittily — edited by humans.” Mobile news consumers on smartphones need more than automated headlines and snippets to keep their attention.
    4. In case you missed it, here’s a great post on Boston tech company / innovation economy performance. Fun fact: 51% of Boston’s “massive winner” companies had an immigrant founder.
    5. Did Apple’s U.S. mobile hardware marketshare peak at 40%? Latest Comscore data spots a flattening trend, compared to a gradual rise of Samsung devices now at 25%. Google’s Android still dominates with 52% of the U.S. mobile software platform market.

    Weekend fun: Sherlock fans and other Cumberbatch disciples, you are in for a real treat: Here’s a video of Benedict Cumberbatch reading R. Kelly’s Genius lyrics.

    Every Friday, find five, highly subjective links about compelling technologies, emerging trends, and interesting ideas that affect how we live and work digitally.

  • Try it: Google define

    Try it: Google define

    Language is always changing, but the arrival of consumer technology over the past 25 years has meant a sharp uptick in our new day-to-day jargon. Terms like modem, pager, or smartphone enter and exit the common usage with remarkable frequency.

    FlowingData this week pointed out how Google’s “define: <word>” feature now displays word etymology via flowchart and graphs word usage over time. Three words graphed over time tell a story of technology adoption and attrition:

    telegram word usage over time

    You can clearly see where telegraphy emerged in the mid 1800s, and how the flat line begins around the time the last telegram is sent in 2006. Telegram remains in the language as a common noun and as a relatively popular name for newspapers, but the arc aligns with the technology in use.

    Next, let’s track fax technology, which clings on doggedly in the finance, law, and healthcare sectors. A sharp rise in the 1990s, but not the subsequent flatline many might assume.

    fax word usage over time 
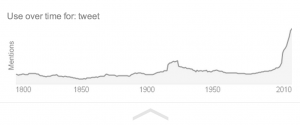
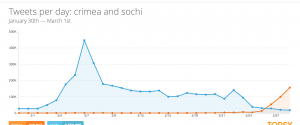
Finally, have a look at tweet:

    tweet word usage over time

    The word tweet meaning “the chirp of a small or young bird” has been around since at least 1800. You see a minor spike in the 1920s, when Jazz Age musicians produce and record “When my sugar comes down the street, all the little birdies go tweet tweet tweet.” But the real hockey stick spike starts in 2006 when Twitter enters the scene.

    As a language geek I love how we can track and quantify language usage in more simple, visual ways. Analyses like souped-up concordances can not only track macro usage trends, but perhaps even diagnose dementia in individual authors. As   visualization tools become more common and accessible, we’ll have more ways to analyze and add context to our understanding of the language we use.

  • Friday 5 — 08.09.2013

    Every Friday, find five quick links about compelling technologies, emerging trends, and interesting ideas. Source: the internet.

    1. Anyone who has ever clicked on a search result only to land on an article stub generated by a content farm will be glad to see this latest Google tweak. This update highlights up to three in-depth articles in the right column, pointing users toward deeper content (and perhaps directing their eyes toward the ads). Big opportunity for publishers of high-value, evergreen content.
    2. 72% of U.S. online adults now use social networks, according to Pew. Breakdowns include slightly more women than men, and Hispanics represented more than African-Americans more than white, non-Hispanic. Retailers take note: adoption rates for adults 65 and older have tripled over the past four years.
    3. A good example of how great content strategy combined with optimizing an existing technology can yield significant returns: Zach Seward on Quartz’s email strategy just as their daily brief expands to weekends.
    4. Boston’s Here and Now covered Silicon Valley-funded Watsi, a startup crowdfunding medical care. This approach raises ethical questions, as well as potential positive implications for nonprofits looking to put a face on unrestricted giving.
    5. In yet another take on mobile, visual storytelling, YouTube founders Chad Hurley and Steve Chen launched the Mixbit video app for iOS. There’s a collaborative element to the storytelling and some solid UX to make recording and editing less daunting.
  • Try it: Visualize search worldwide

    US search terms trending

    Add another curiously mesmerizing big data visualization to your procrastination list. This colorful visualization serves up a (presumably filtered for a G rating) constantly-updating view of all the Google search terms people in the U.S. are entering in near real-time. For fun, toggle over to see search terms in ten other countries, including Australia, India, and Russia.

    Feature request: a customized version for brands to visualize the terms most frequently associated with the brands, like “Arsenal + Wenger” or “Harvard + financial aid.” There are other ways to discover those terms, but would be terrific to visualize them out of the box for a presentation on brand associations.